
Table of Contents
- Overview
- Turning Security Advisories on or off
- Viewing your security findings
- Running a security scan
- The Security Digest email
- Managing digest notifications
- Fixing what you find
- Troubleshooting
- Related Documentation
Overview
What Security Advisories does
Every WordPress site is built out of parts: WordPress itself (called core), plus plugins (small add-ons that give your site extra features — a contact form, a shop, a booking calendar) and a theme (the part that decides how your site looks).
Those parts are written by thousands of different people, and from time to time a flaw is discovered in one of them — a mistake that someone could abuse to break into a site, steal data, or deface pages. When that happens, security researchers publish a public notice about it. That notice is called a security advisory. It says which add-on is affected, which versions of it are affected, how serious the problem is, and usually which newer version fixes it.
Security Advisories in EasyEngine Dashboard reads the list of parts installed on each of your WordPress sites and compares it against those published advisories. If a site is running a version of a plugin, theme or WordPress core that a published advisory says is vulnerable, EasyEngine Dashboard tells you — on the dashboard, and in a daily email.
That is the whole idea. EasyEngine Dashboard does not change anything on your site and does not try to break into it to prove a point. It reads a list, compares it to another list, and shows you where the two overlap.
Alongside vulnerabilities, the same screen also shows two kinds of ordinary maintenance that are worth knowing about:
- WordPress core is out of date — a newer WordPress version is available.
- PHP is approaching end of life — PHP is the programming language your site runs on, and each version is only supported for a few years. Once support ends, it stops getting security fixes.
Neither of those is a known vulnerability, so EasyEngine Dashboard counts them separately and labels them Updates rather than giving them a severity.
In short: EasyEngine Dashboard checks what is installed, compares it to published security advisories, and shows you what needs attention. You stay in control of what gets updated.
Common questions before you start
Does it change anything on my sites? No. Security Advisories only ever reads. A scan runs two listing commands on the site — the equivalent of asking “which plugins are installed, and at what versions?” — and writes nothing. Updating anything is always your decision and your click.
Will scanning slow my sites down? A scan reads a list and disconnects; it is not a crawl of your pages and it does not generate visitor-like traffic. Scanning many sites at once is spread out in background batches rather than fired off all together.
Is there anything extra to buy? No. Security Advisories is not a plan feature or a paid add-on — there is nothing to purchase and nothing to enable in your subscription. The only two switches are the organization one and the platform-wide one described below.
Who can see my findings? The same people who can already see the site: members of the organization it belongs to, according to their role. In addition, EasyEngine Dashboard administrators — the people who operate your EasyEngine Dashboard installation — can see reports across organizations, as they can for the rest of your hosting data. There is no way to hide a site’s findings from someone who can already open that site.
Does anything happen automatically? Yes, two things — and neither touches your sites. Scanning runs nightly on its own, and a digest email goes out to the people listed under Who receives it without each of them having to opt in. If your organization has Security Advisories switched on, your colleagues with the right roles will start receiving that email.
Which sites are covered
Security Advisories works on WordPress sites hosted on your EasyEngine servers.
Two words worth pinning down first, because the whole coverage question turns on them:
- EasyEngine sites are the ones running on servers you manage through EasyEngine Dashboard — if a site sits on a server you can see under Servers in the sidebar, it is one of these. These are covered.
- WP Cloud sites are hosted on WP Cloud, a separate hosting platform EasyEngine Dashboard can also manage for you. They do not run on your own servers, and they are not covered.
| Site | Covered? |
|---|---|
| WordPress site on an EasyEngine server | ✅ Yes |
| PHP site | ❌ No — there is no plugin or theme list to check |
| HTML (static) site | ❌ No — same reason |
| WP Cloud site | ❌ No — see below |
| Archived site | ❌ No — Archived sites don’t exist anymore. Nothing to scan. |
A site also needs to be in a workable state for a fresh scan to run. To collect a new list of installed plugins and themes, EasyEngine Dashboard needs the site to be Live (up and serving visitors), reachable, and not locked. Locked means the site has been restricted because your organization is over one of its plan limits — upgrading the plan, or removing sites you no longer need, releases it.
A site that is disconnected, still being set up, disabled, or in a failed state is skipped, and the scan result tells you exactly which sites were skipped and why.
You can still read the last stored report for a disconnected site — the results are saved, so losing the connection does not lose the findings.
WP Cloud sites are not covered
If you host sites on WP Cloud, those sites do not have a Security tab and do not appear in the advisory report or the digest. WP Cloud sites are managed differently, and advisory scanning is not available for them as of today. In the Sites list, a WP Cloud row simply says it is outside advisory scanning when you hover over its Security column.
Turning Security Advisories on or off
There are two switches, and both have to be on for scanning to happen.
The organization switch
This is your switch. It decides whether the WordPress sites in your organization are scanned at all.
To turn Security Advisories on or off for your organization:
- Open Settings from the sidebar.
- Go to the Security tab.
- At the top you will see a card called Security Advisories with a line that reads “Currently: Enabled” or “Currently: Disabled”.
- Click the Enable or Disable button beside it.
- A confirmation box appears explaining exactly what that click will do. Read it, then confirm.
Turning it on means: every WordPress site in the organization is checked against the advisory data on each nightly refresh, and everyone with access gets a digest of what is found.
Turning it off means: scans and digests stop, and the report comes off the page.
Note: New organizations have this switched on by default.
Who can change it
| Role | Can see the Security tab and the report | Can run a scan | Can flip the switch |
|---|---|---|---|
| Organization Owner | ✅ | ✅ | ✅ |
| Organization Admin | ✅ | ✅ | ✅ |
| Organization Manager | ✅ | ✅ | ❌ |
| Organization User / member | ✅ (for sites they can see) | ❌ | ❌ |
If you can see the switch but the button is greyed out, you have viewing access but not the permission to change it. Ask an organization owner or admin.
What happens when it is off
Turning Security Advisories off for your organization is safe and reversible:
- No new scans run.
- No digest emails or in-app notices are sent.
- The Security tabs, badges and the Sites list Security column disappear.
- EasyEngine Dashboard also stops collecting the list of installed plugins and themes during the nightly refresh.
- Everything already collected is kept. Turn it back on and your last report is there again, ready to be refreshed with a new scan.
Viewing your security findings
Where to look
The same report is available at three levels. Pick the one that matches the question you are asking.
| I want to know… | Go to |
|---|---|
| How is my whole organization doing? | Settings → Security |
| What about the sites on this one server? | Server page → Security tab |
| What about this one site? | Site page → Security tab |
| Which of my sites need attention right now? | Sites list → Security column |
The organization Security tab
Settings → Security shows the report for every WordPress site in your organization, below the on/off switch described above.
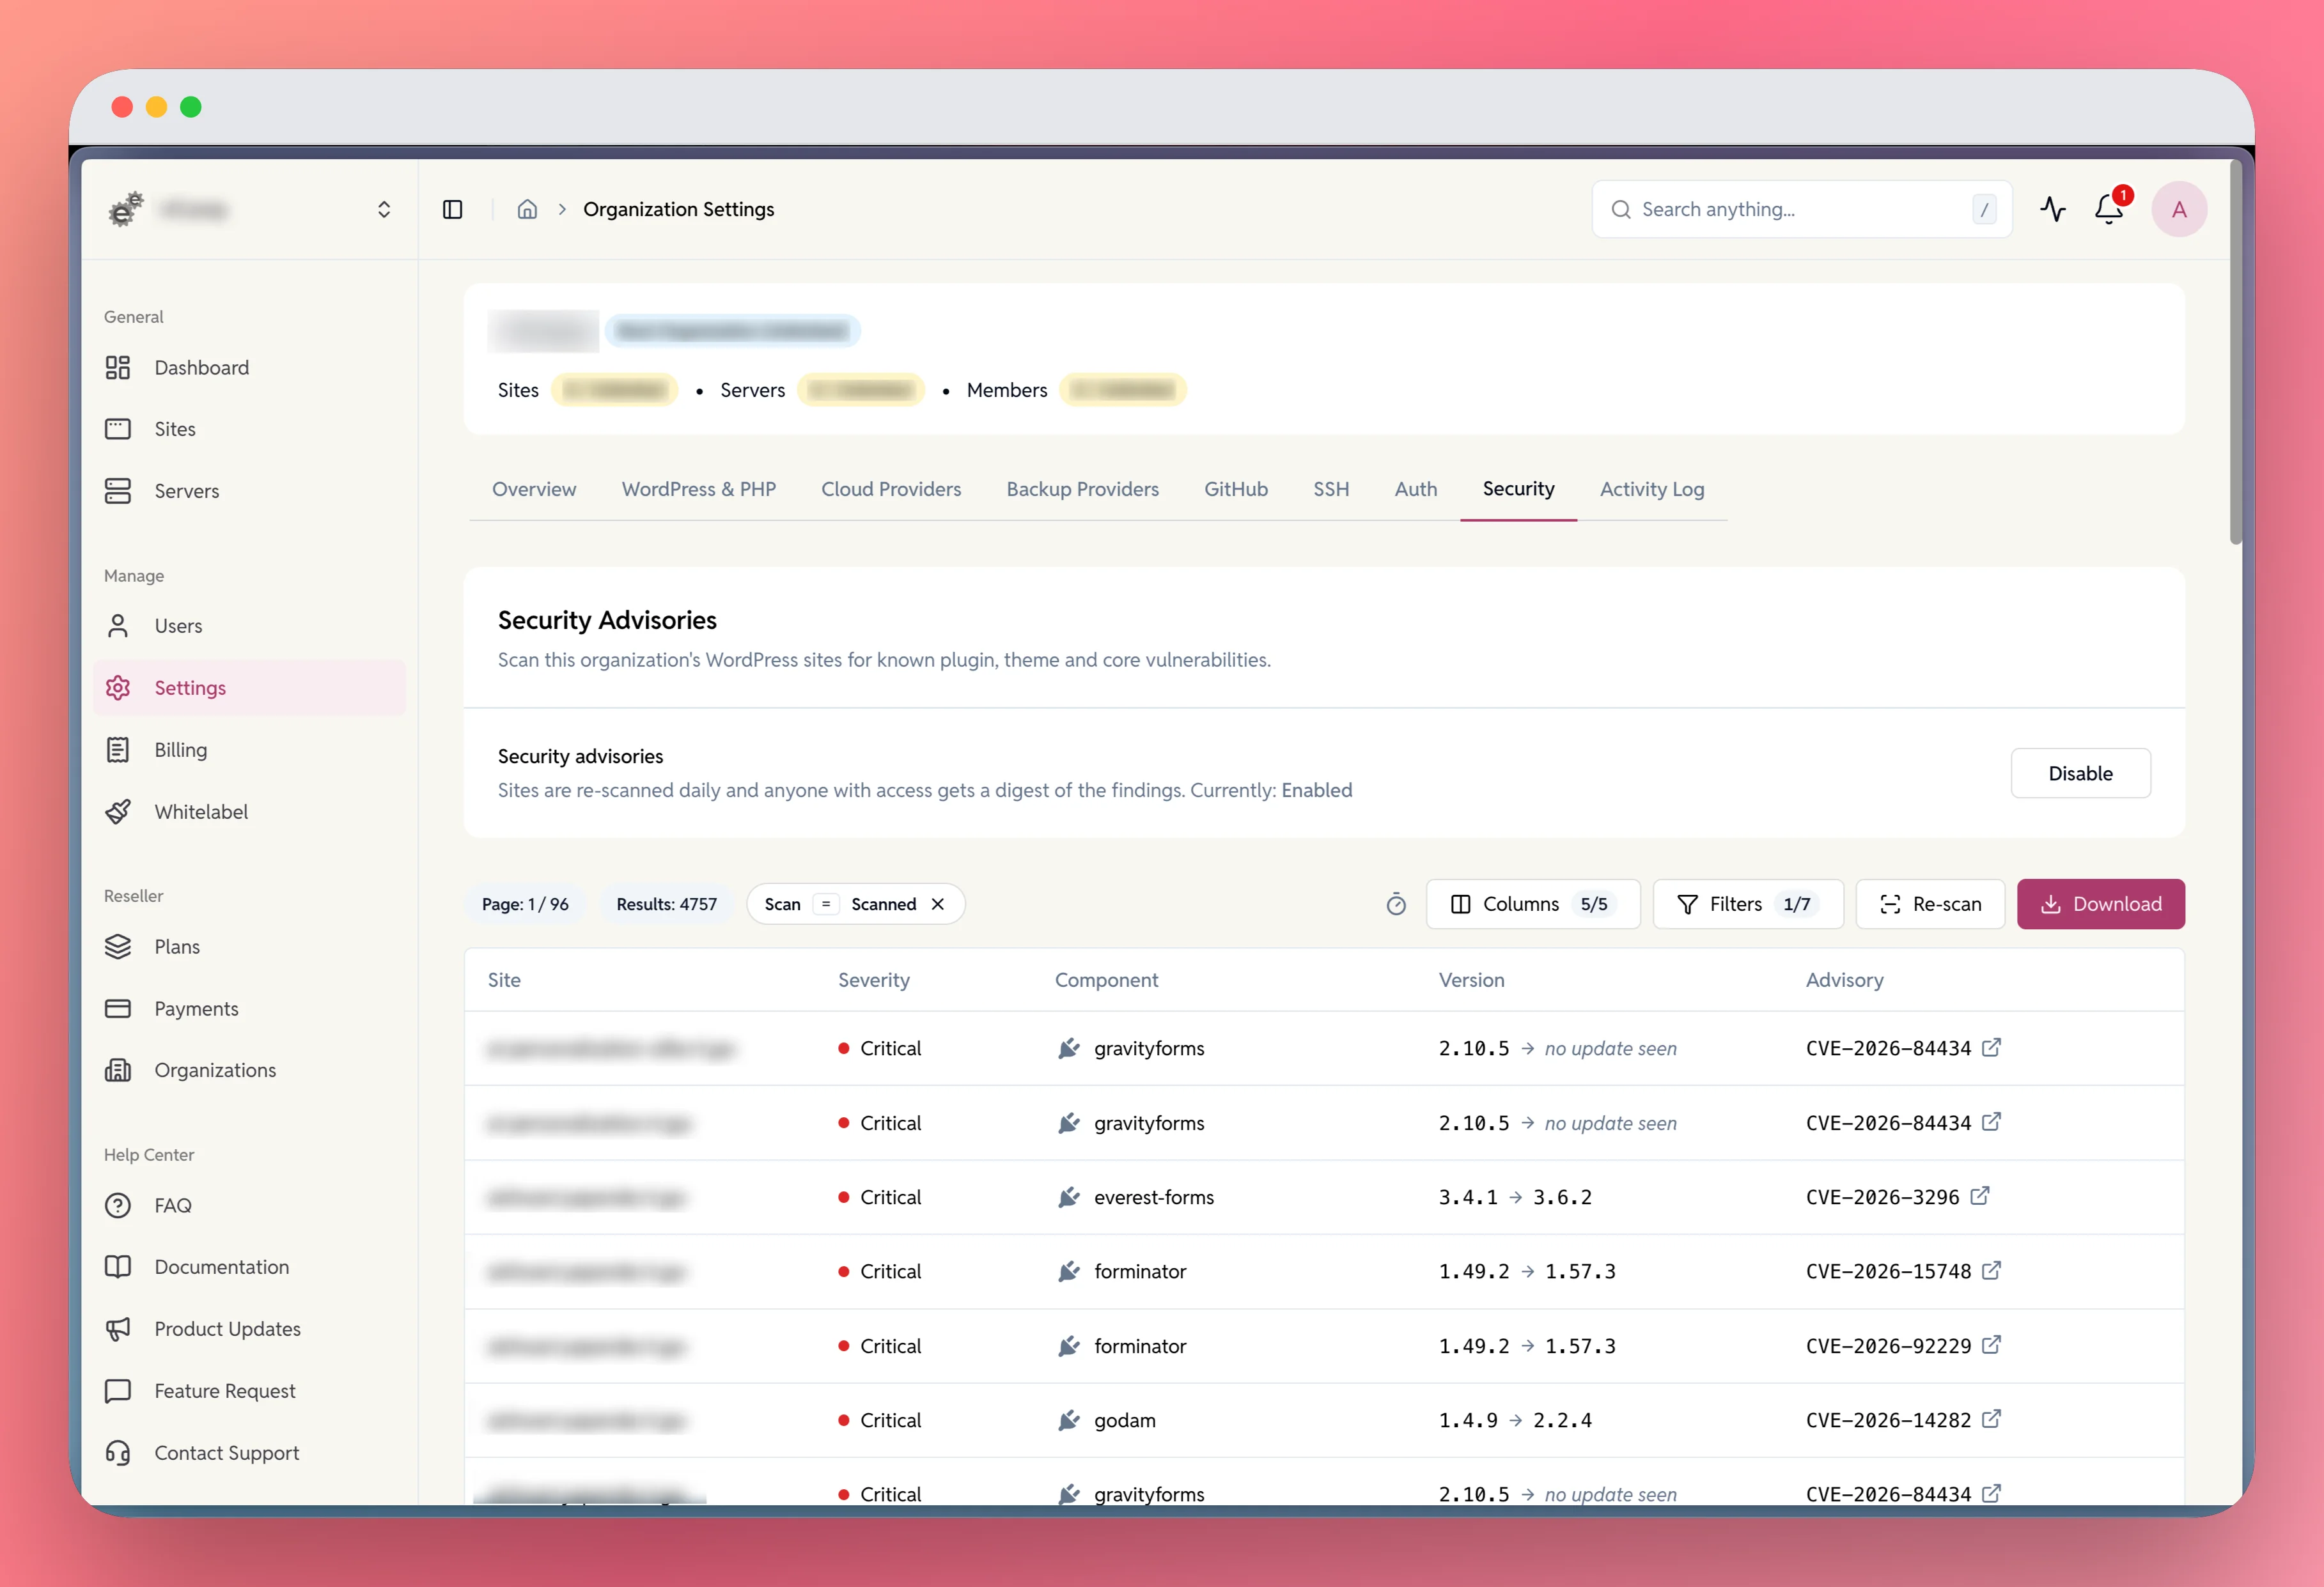
This is the best place to start. One table, every site, worst findings first.
The Security tab only appears if EasyEngine hosting is available on your account.
The server Security tab
Open a server and go to the Security tab to see only the sites hosted on that server.
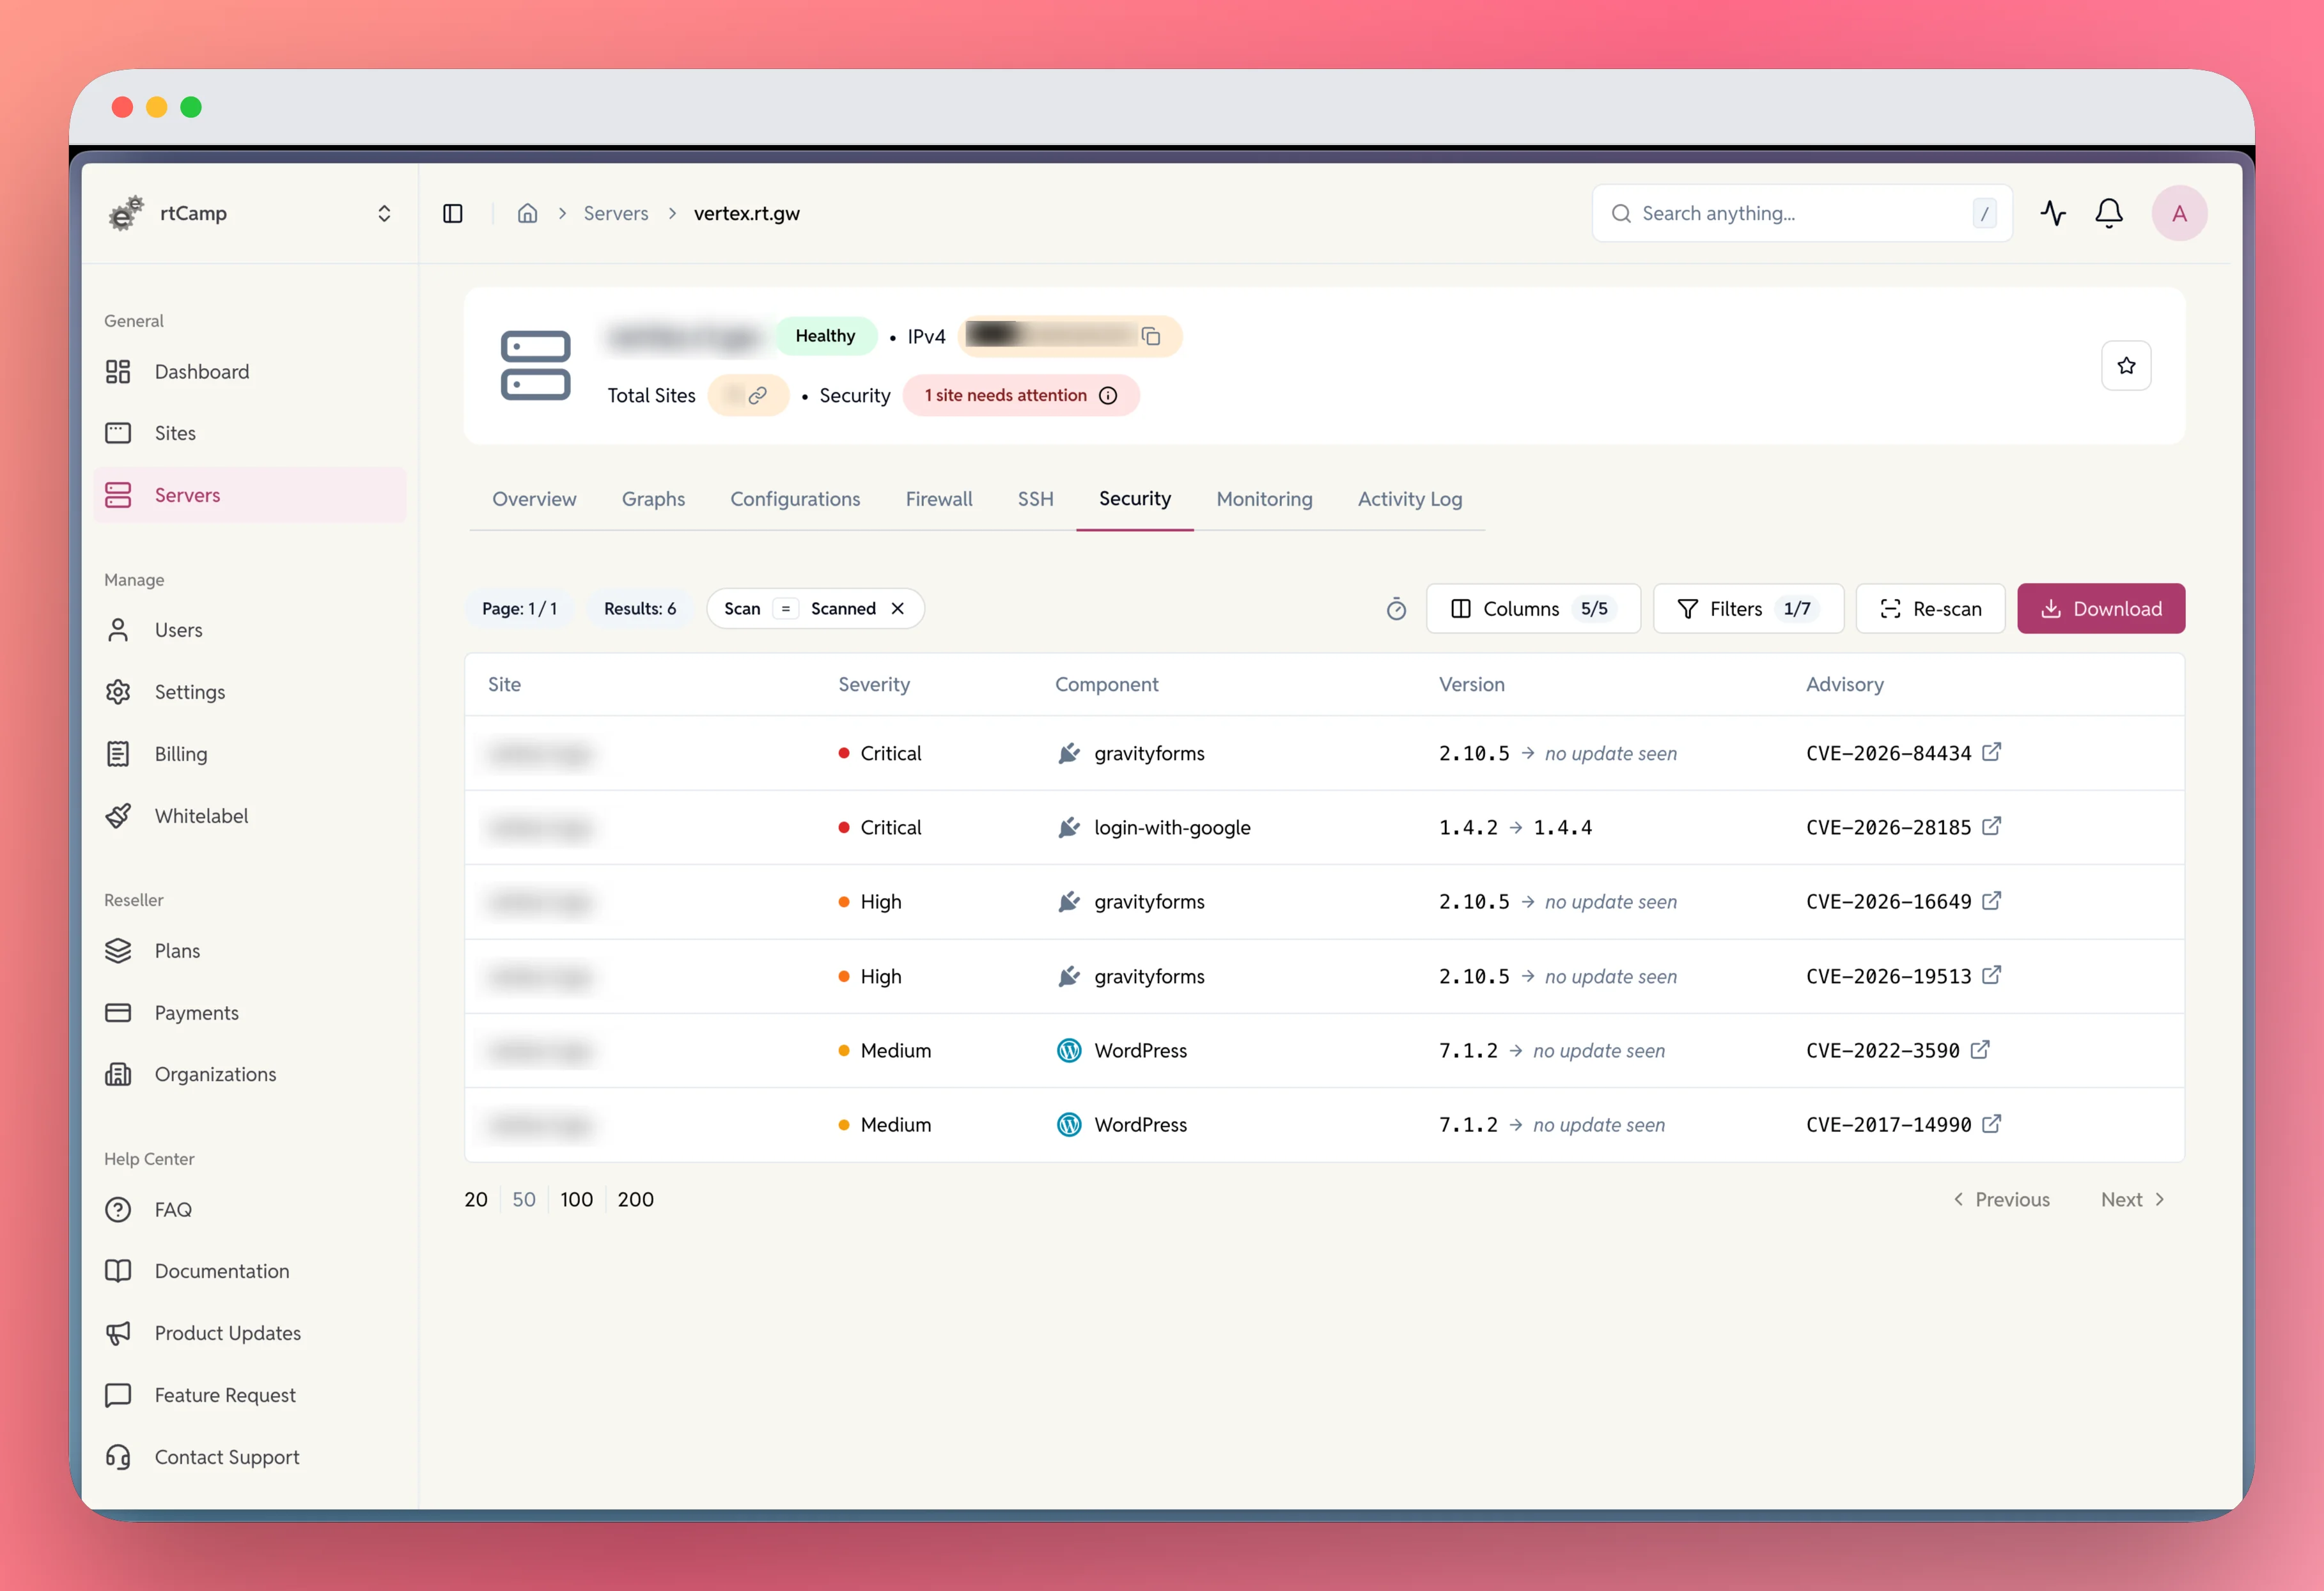
The server page header also carries a one-line summary above the tabs, so you get the gist without opening the tab. It reads like a sentence and only mentions what is actually true for that server, for example:
1 sites need attention · 1 site has pending updates · 2 sites not scanned
Hovering each phrase explains what it counts. If everything is scanned and clean, it says No known vulnerabilities.
The server Security tab is shown when the server is Healthy — EasyEngine Dashboard’s word for a server it can reach and that is running normally. While a server is still being set up, or is having trouble, the tab is not offered. Each site on it still has its own Security tab, though whether a fresh scan can run depends on whether that site is reachable.
The site Security tab, badge and Overview card
A single WordPress site shows its security standing in three places:
- A badge in the page header, right beside the site’s status. It reads something like
• Vulnerabilities [2 Critical, 8 High], coloured by the worst thing found. If the site has been scanned and nothing was found, it reads None known in green. - A Security Advisories card on the Overview tab, with:
- a count for each severity band,
- Updates that clear findings — how many components have an available update that would clear every finding against them,
- WordPress Checksum — a separate check that confirms your WordPress core files have not been tampered with,
- Last scanned and Next scheduled scan.
- A Security tab with the full table for that site. Because every row is about the same site, the Site column and Site filter are dropped; everything else works exactly as it does at the organization level.
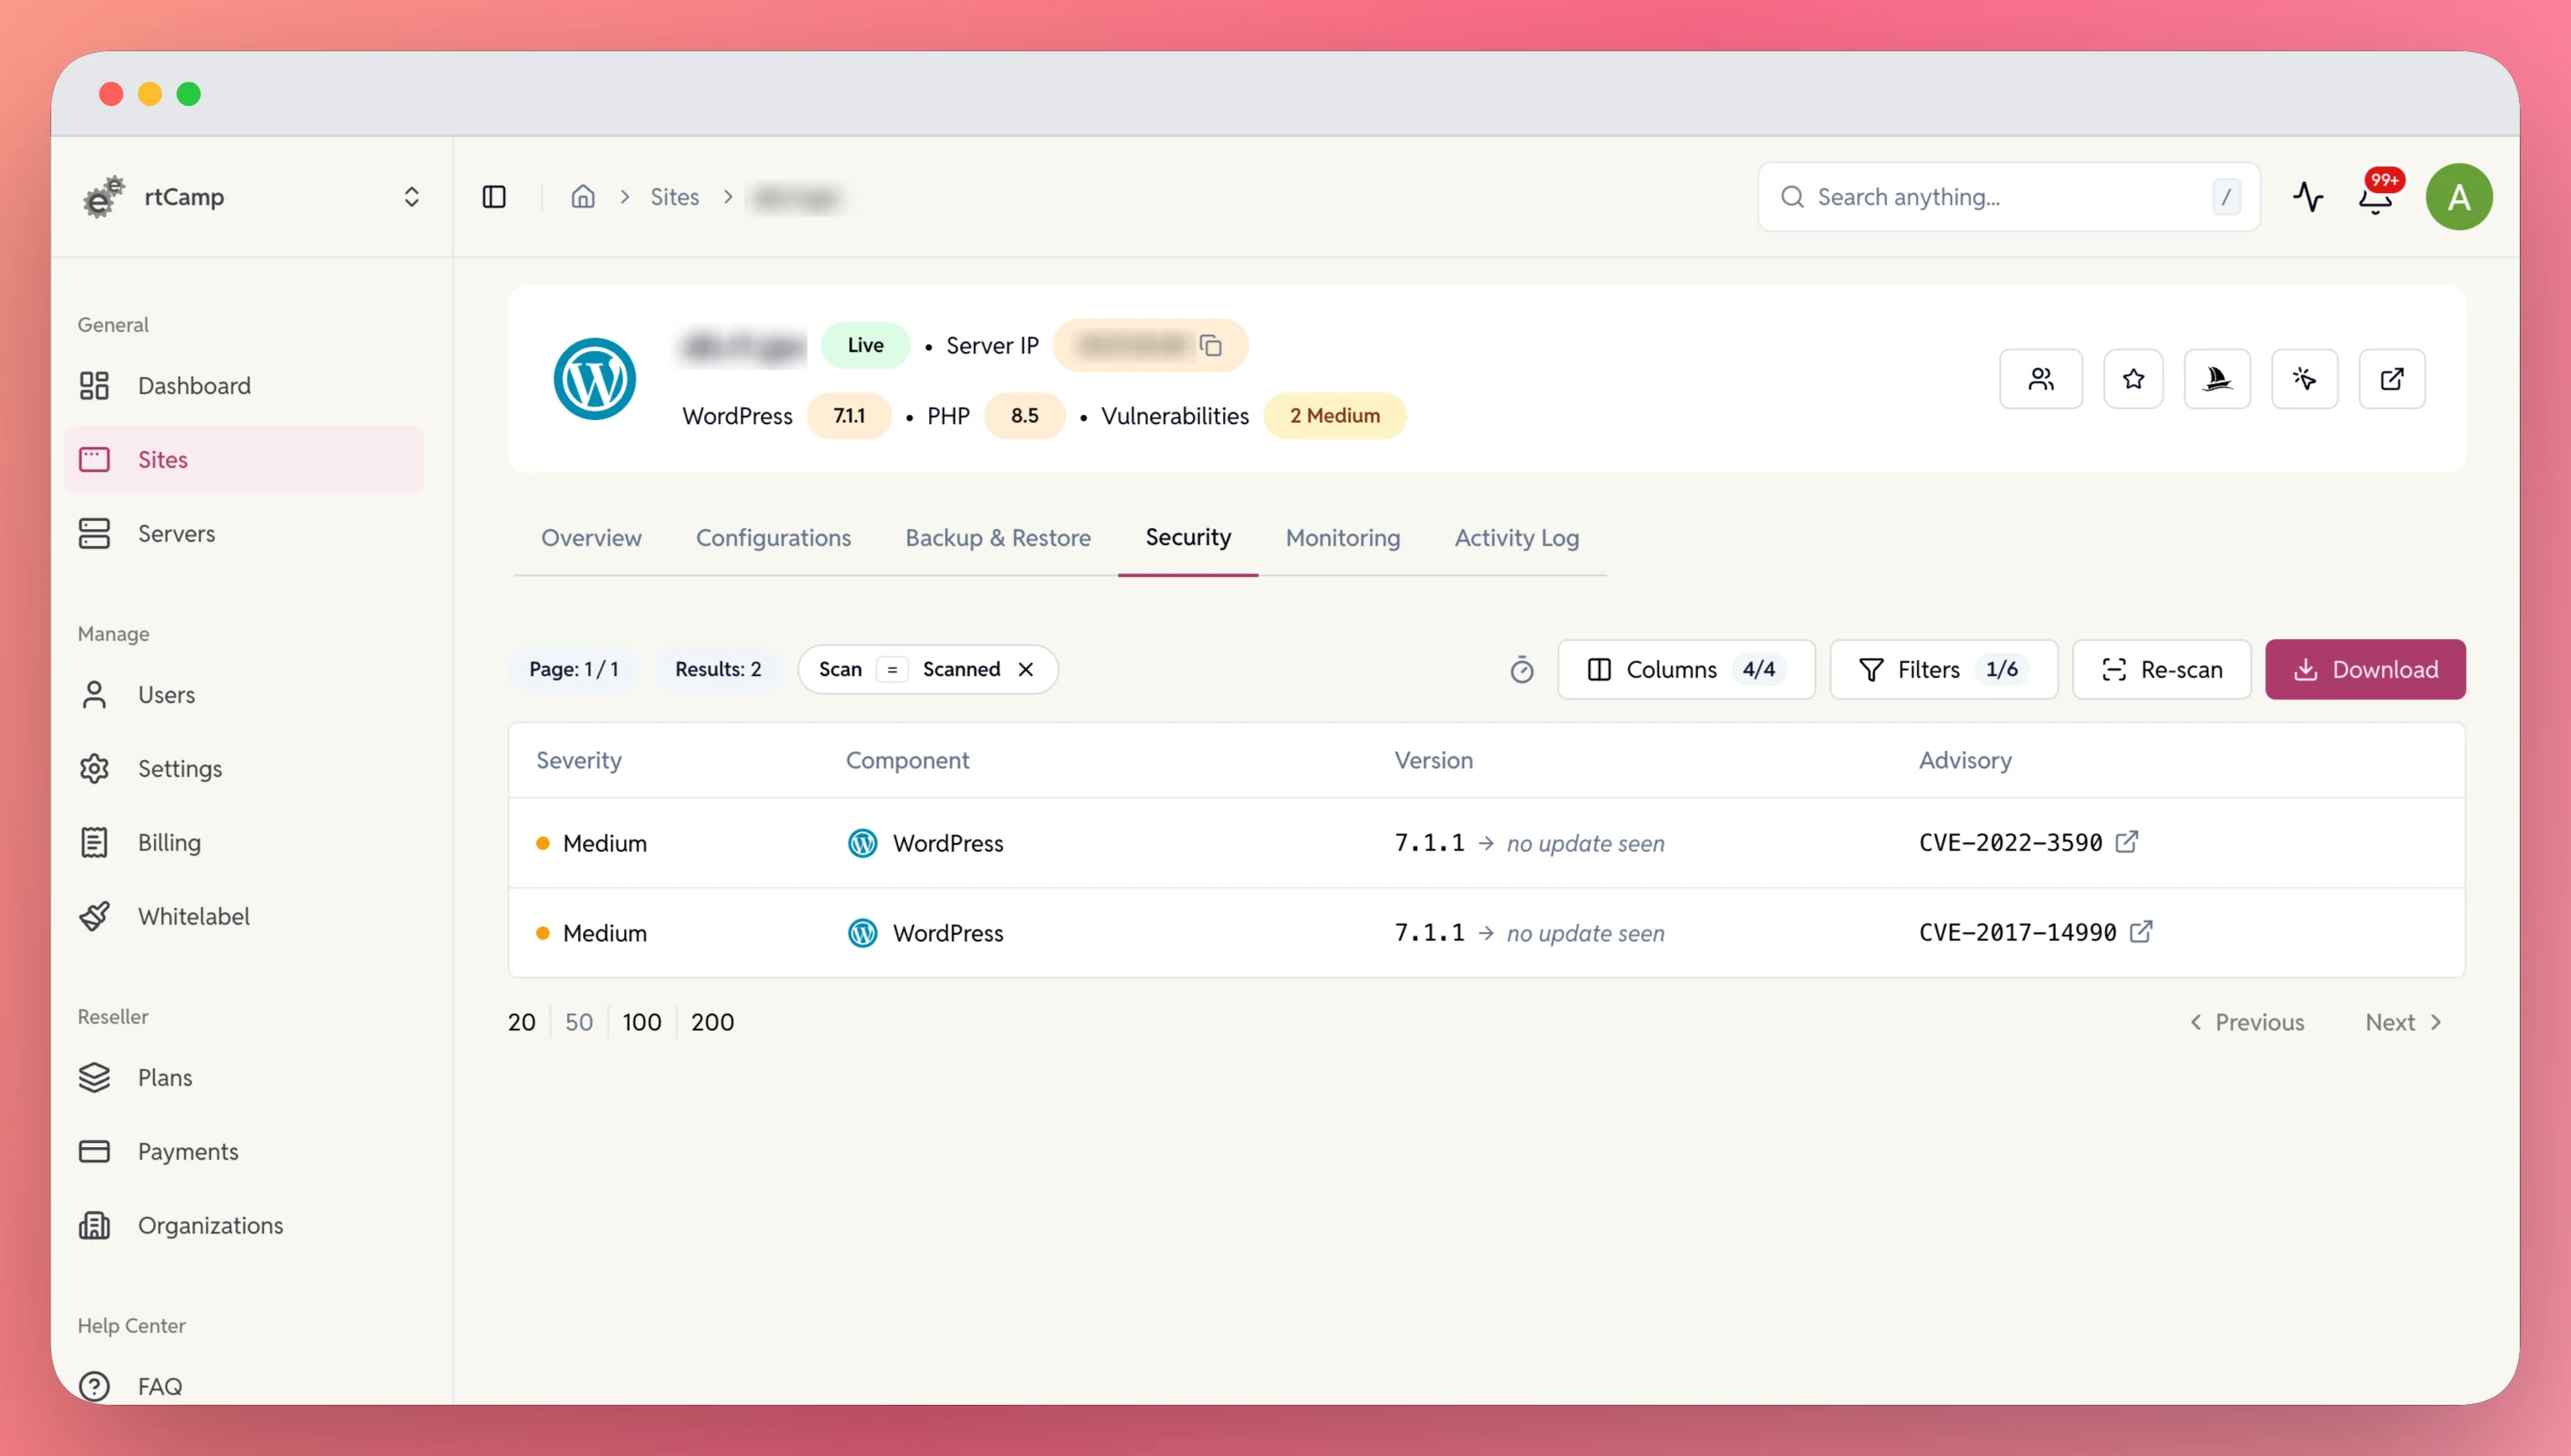
Tip: you can link straight to it —
…/web/site/<your-domain>?tab=security.
The Sites list
The Sites list has a Security column showing each site’s worst findings at a glance, for example 3 High, or None known for a clean site.
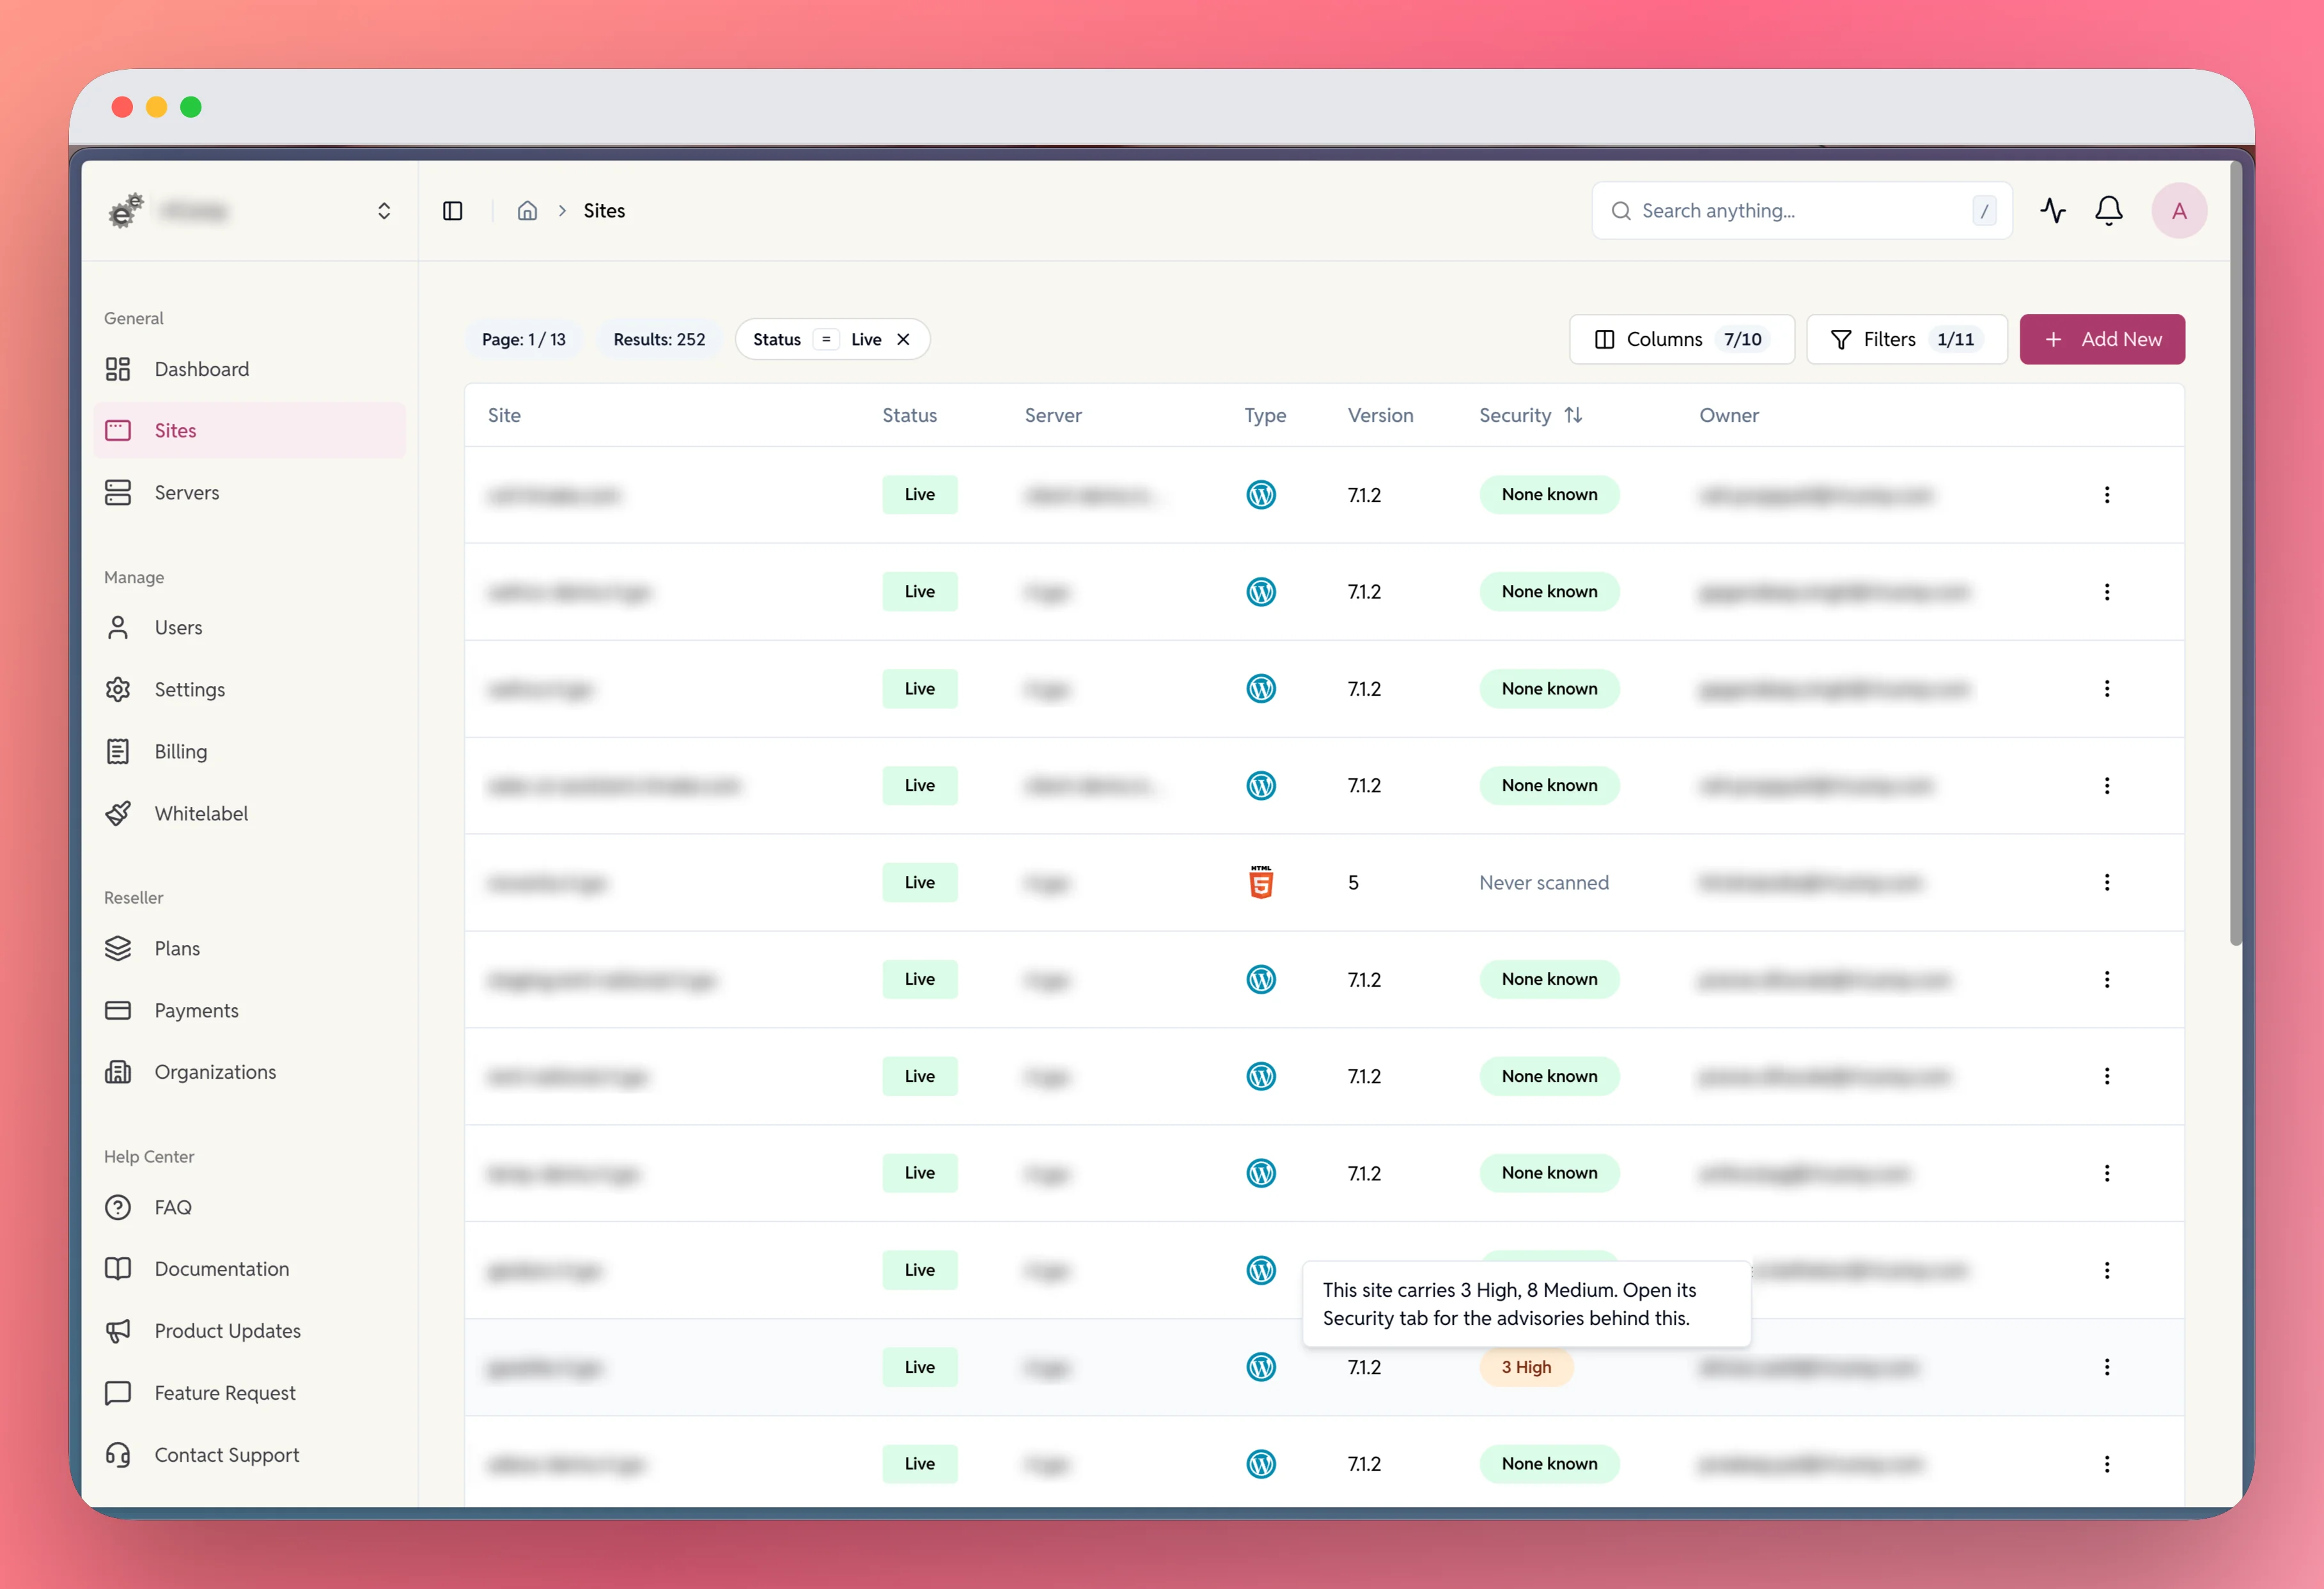
- Click the Security header to sort by risk (worst first, then least severe first, then back to the default order).
- Use the Severity filter to show, say, only sites whose worst finding is Critical.
- Click a badge to jump straight to that site’s Security tab.
One caveat worth knowing. The badge in the list counts confirmed findings only. A site whose only rows are Informational — advisories with no available fix, described below — will read None known here, while its own Security tab shows them. The list is a signpost for “what needs attention today”, not the last word on a site. When you want the complete picture for a particular site, open its Security tab.
Reading the table
The report table has five columns:
| Column | What it tells you |
|---|---|
| Severity Level | The severity level – one of Critical, High, Medium, or Low. |
| Site | Which site this row is about. (Hidden on a single site’s tab.) |
| Component | Which part of the site this is about. You will see the word component a lot — it just means “a plugin, a theme, WordPress core, or PHP”. |
| Version | What is installed, and what to move to — for example 1.3.2 → 1.4.4. |
| Advisory | A one-line description of the problem, linking out to the public advisory. |
Above the table you will find:
- Summary tags telling you what the report contains at a glance.
- A Timer icon — hover it for Last scan and Next scheduled scan.
- Columns — show or hide columns.
- Filters — narrow by Site, Severity, Confidence, Type, Scan, Fix available or Component.
- Re-scan and Download.
If the Version cell says no update seen, the site itself did not report an update for that component. That is very common with paid (premium) plugins: without an active licence key, the site never learns that a newer version exists. It does not mean there is no fix — check the licence, or download the update from the vendor directly.
Severity levels
Severity is how serious the published advisory says the problem is. EasyEngine Dashboard uses the severity the advisory itself carries:
| Level | What it means in practice |
|---|---|
| Critical | Fix these first. An attacker who knows about one of these could potentially take over the site, so they are worth handling the same day. |
| High | Fix soon. Serious, and usually straightforward to clear with an update. |
| Medium | Worth scheduling. Real, but harder to abuse or more limited in effect. |
| Low | Minor. Clear it when you are next doing maintenance. |
| Unrated | The advisory was published without a severity. Treat it as “look at this”. |
| Updates | Not a vulnerability at all — an available WordPress update, or a PHP version nearing end of support. Counted separately, and never mixed into the severity totals. |
Certain, Needs review, and the two hidden kinds
Matching an installed version against an advisory’s list of affected versions is usually straightforward, but not always. Rows come in four kinds — and they live behind two different filters, which is worth getting straight before you go looking for them.
The two kinds you always see, sorted between by the Confidence filter:
- Certain — the installed version definitely falls inside the range the advisory names. This is a real finding, and it is what the counts, badges and digest are made of.
- Needs review — EasyEngine Dashboard could not decide, and says so rather than guessing. This happens when the installed version cannot be read, or when the advisory describes its affected versions in a form EasyEngine Dashboard cannot interpret. Someone should look at these by hand.
The two kinds left out by default, revealed by the Type filter:
- Informational — an advisory that applies to every version of something, with no update that would clear it. No update will fix it; the real decision is whether you still want that plugin or theme installed at all. Kept out of the counts, because a number you cannot act on is just noise.
- Ignored — an advisory you or your colleague(s) have deliberately set aside for everybody, usually because it has already been assessed and accepted.
So: Confidence narrows down the rows already on the table. Type goes and fetches the ones that were not loaded. To see Informational or Ignored rows, open Filters → Type and pick one.
Whenever rows are being left out, the report tells you — for example “12 rows, plus 3 hidden (2 informational, 1 ignored)” — so an empty table is never mistaken for a clean bill of health.
The downloaded CSV always contains every row, hidden ones included.
Coverage: which sites were actually checked
This one matters more than it sounds. A report with no findings can mean two completely different things: nothing was found, or nothing was looked at. EasyEngine Dashboard never lets those two blur together.
Sites the report has nothing to say about appear as their own rows, marked Skipped, with a reason:
- Never scanned — no scan has read this site yet.
- Needs a re-scan — this site was scanned a while ago, but the saved result is in an older format that can no longer be displayed. Run a scan and it will be rebuilt.
- Couldn’t load the report — The report couldn’t be loaded. Run a scan again.
By default the table opens with a Scan = Scanned filter already applied, so you see findings first. Remove that filter (or switch it to Skipped) to see the gaps. When the table is empty, it names the uncovered sites for you — hover “N sites not covered” to see which ones.
The three empty states are worth telling apart:
| The table says | It means |
|---|---|
| No Known Vulnerabilities | Sites were scanned, and nothing installed on them matches a published advisory. Genuinely good news. |
| Reports Need a Fresh Scan | The saved results are in an older format. Run a scan and they will be rebuilt. |
| No Scan Has Run Yet | Nothing has been scanned yet, or there are no WordPress sites here to scan. |
Downloading the report
Click Download on any Security tab to save the report as a CSV file — a spreadsheet you can open in Excel, Numbers or Google Sheets.
The file contains one row per site and advisory, with every column the screen shows plus a few more: the server, a direct link to the site in EasyEngine Dashboard, the exact version range that matched, the advisory ID, and the time the site was scanned. Every row is included, including the informational and ignored ones hidden on screen.
This is the right thing to hand to a developer, an agency, or anyone who needs to work through the list outside EasyEngine Dashboard.
Running a security scan
Scans run automatically once a day as part of the nightly refresh, so you normally do not need to do anything. Run one by hand when you want an answer now — after you have updated a batch of plugins, for example, or after adding a new site.
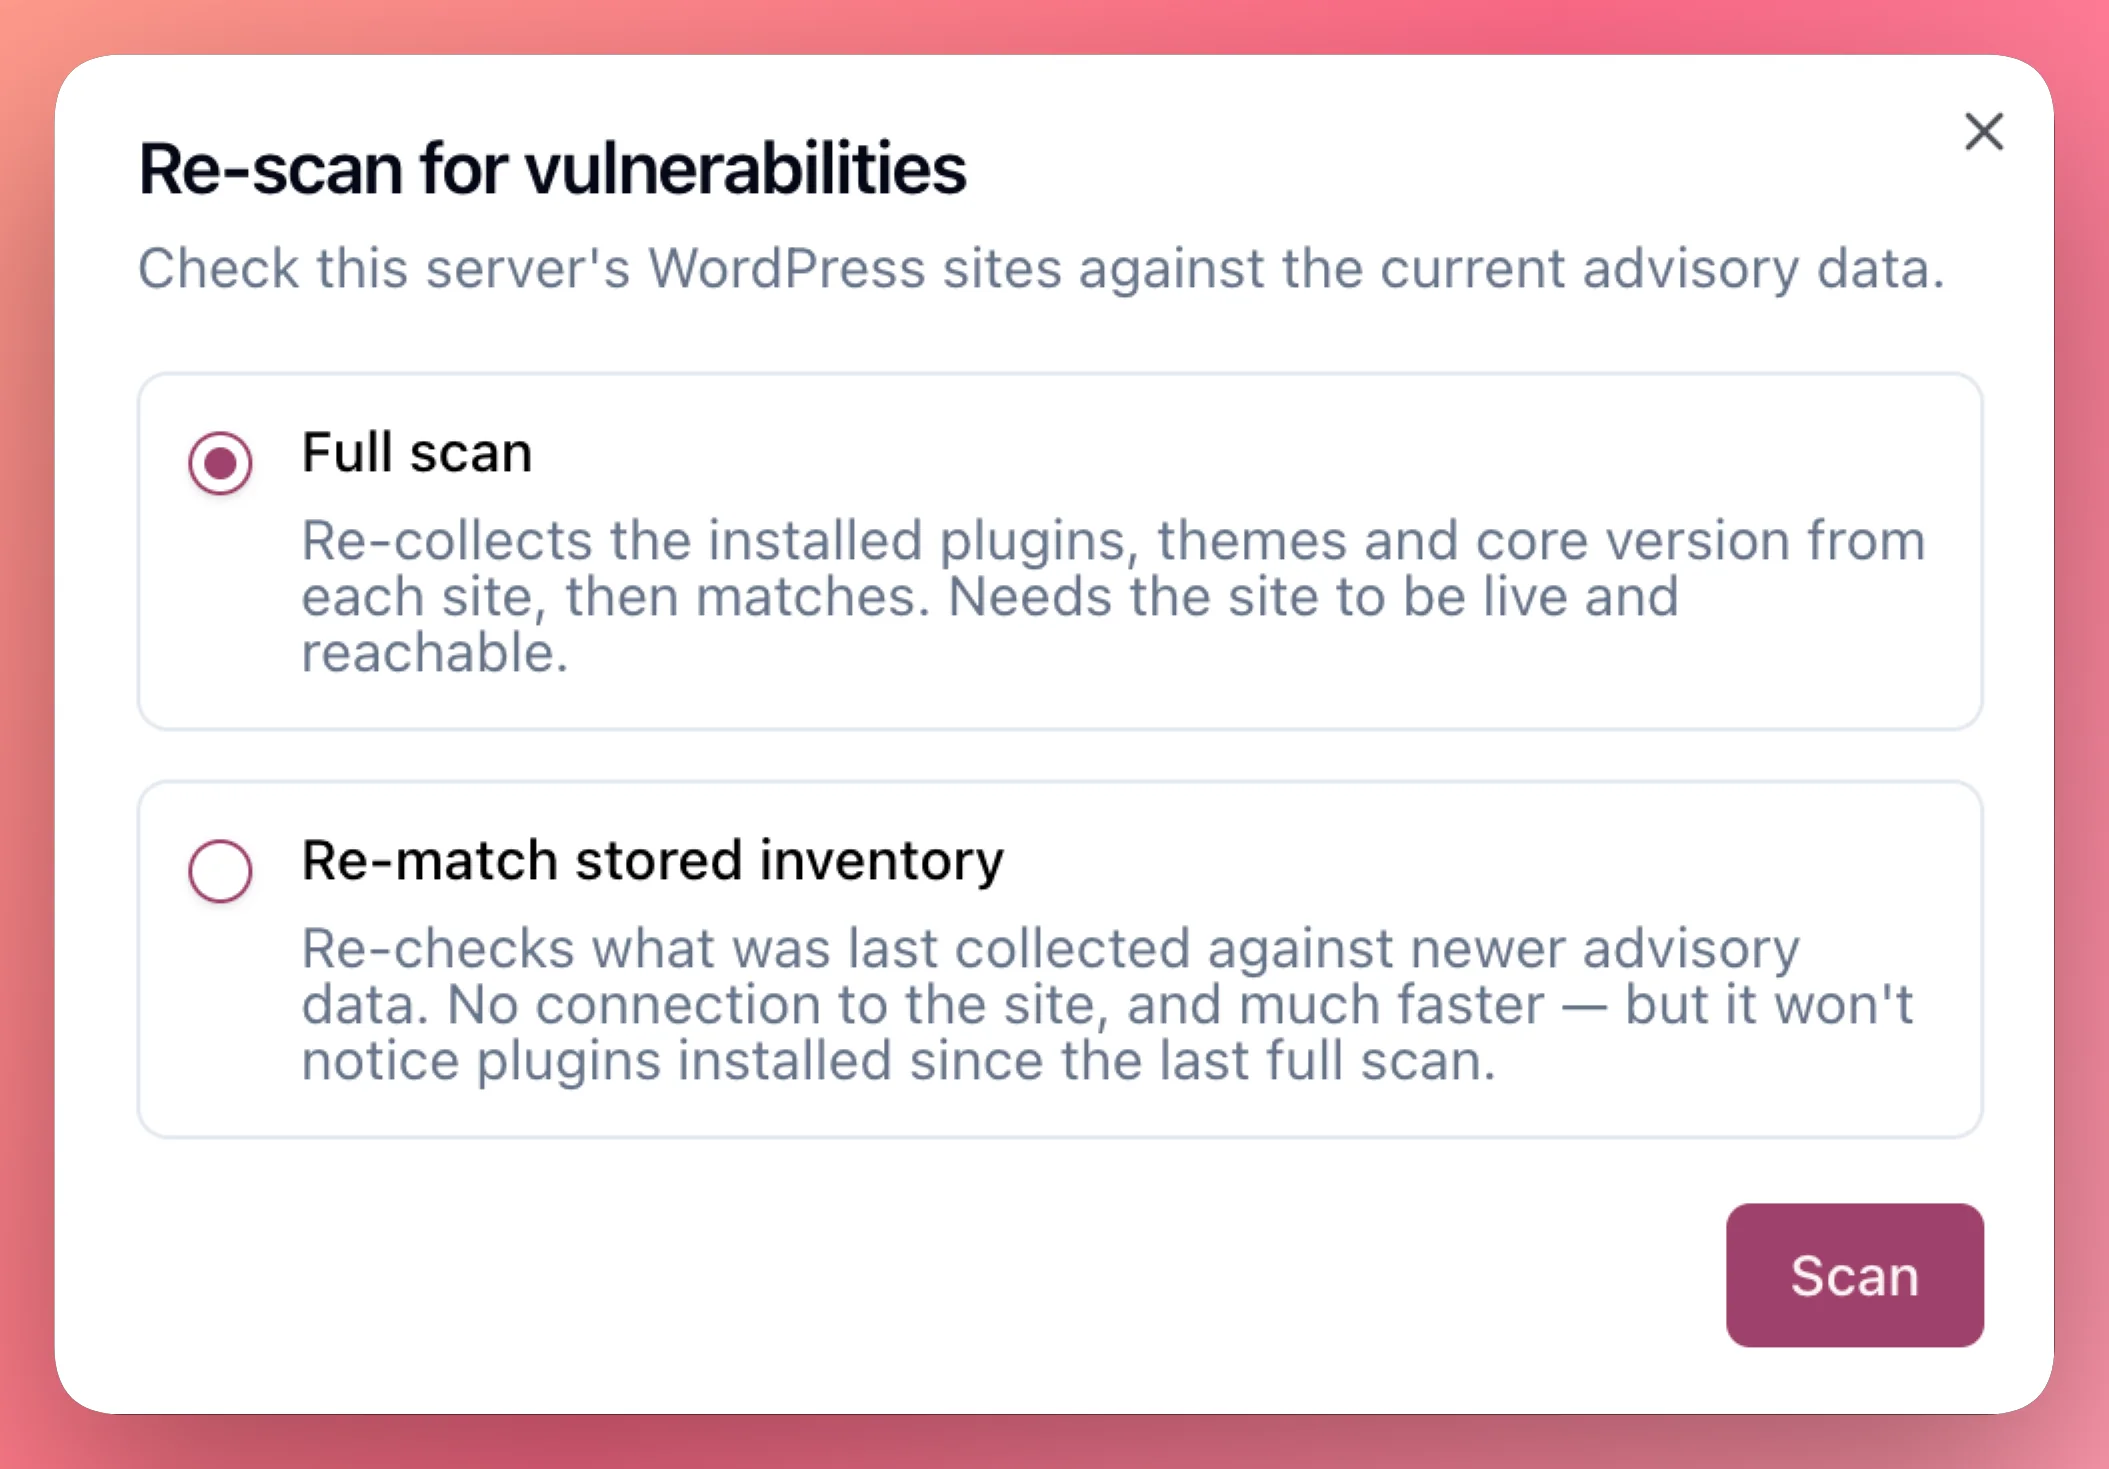
Full scan vs. re-match
When you click Re-scan, EasyEngine Dashboard asks which of two things you want:
| Mode | What it does | How long | When to use it |
|---|---|---|---|
| Full scan (default) | Connects to each site, re-reads which plugins, themes and WordPress version are actually installed, then compares against the advisory data. | Minutes | After you have changed something on the site — updated, installed or removed a plugin or theme. |
| Re-match stored inventory | Skips the site entirely and re-checks the list collected last time against the latest advisory data. | Seconds | When you just want to know whether any new advisories affect what you already have. It will not notice plugins installed since the last full scan. |
A full scan needs the site to be Live and reachable. A re-match needs no connection at all — which makes it the one that still works for a disconnected site, as long as that site has been fully scanned at least once before.
Step-by-step: scanning one site
- Open the site from the Sites list.
- Go to the Security tab.
- Click Re-scan (top right).
- Choose Full scan or Re-match stored inventory.
- Click the confirm button.
- You will see which sites were queued. Results land in the report as each scan finishes — give it a few minutes, then refresh the page.
Step-by-step: scanning a server or an organization
Exactly the same, from a wider starting point:
- A whole server: open the server → Security tab → Re-scan. Every WordPress site on that server is queued.
- A whole organization: Settings → Security → Re-scan. Every WordPress site in the organization is queued.
Big selections are queued up in the background in batches rather than run all at once, so a fleet-wide scan is designed not to tie up the dashboard while it works. There is no progress bar — the report simply fills in as scans complete.
Reading the scan plan
After you confirm, EasyEngine Dashboard shows a table of exactly what it did with your request. Sites it could not scan are named, with the reason, never silently dropped:
| Reason shown | What to do |
|---|---|
| not a WordPress site | Nothing — PHP and HTML sites are not scanned. |
| security advisories are disabled for this organization | Turn the organization switch on. |
| not Live (status: …) | Wait for the site to come up, or use re-match instead. |
| disconnected | Fix the server connection, or use re-match instead. |
| locked | The site is restricted because the organization is over a plan limit. Upgrading the plan, or removing sites you no longer need, releases it. |
| no inventory collected yet — run a full scan first | You asked for a re-match on a site that has never had a full scan. Run a full scan. |
| a refresh/scan job is already running | Nothing — a scan is already in progress for that site. |
| trashed | Nothing — deleted sites are not scanned. |
The Security Digest email
Once a day, EasyEngine Dashboard emails you a short summary of the security standing of the sites you are responsible for. It is called the Security Digest.
Who receives it
You receive a digest covering a site if any of these is true:
- You own the site (and are still a member of its organization),
- You are the owner of the organization the site belongs to,
- You are an Organization Admin of that organization,
- You are an Organization Manager of that organization.
Every recipient gets one email covering all of their sites, whichever organizations those sites are in. Disabled user accounts, and EasyEngine Dashboard’s own automation account, never receive one.
When it arrives
- It is compiled overnight, so it is waiting for you in the morning. (The exact hour is set by whoever runs your EasyEngine Dashboard installation; it is early morning, not midday.)
- If anything has changed since your last digest, it is sent.
- If nothing has changed, EasyEngine Dashboard does not email you the same list again the next morning. It waits and re-sends the unchanged summary once a week, so you get a regular reassurance without a daily duplicate.
What is in it
The subject line leads with the thing that matters most, so you can judge how urgent it is straight from your inbox:
Security digest, 15 Sep: 3 critical and 11 high findings on 7 sites Security digest, 15 Sep: nothing above high, 2 items to check by hand Security digest, 15 Sep: all 40 sites clear
Inside, the body is a short list of plain facts — no tables to squint at on a phone. Only the lines that apply to you are shown:
- The headline — how many sites have at least one finding serious enough to report (Critical or High, unless your administrator has changed the threshold), and the split by severity. “Updating the affected plugin, theme or core clears a finding.”
- What changed — a comparison with your previous digest: “Nothing changed since the last digest on 14 Sep”, or “3 sites got worse, 5 got better, 1 is new to the list”.
- Findings with no update available — how many findings are in plugins or themes where the site does not see an update, and the three add-ons responsible for most of them. “Check the licence on those sites, then update from the vendor.”
- Items needing a manual check — how many rows EasyEngine Dashboard could not decide on its own, and how many sites they are spread across.
- Sites that were not scanned — counted, so a clean-looking email never hides a blind spot.
- Sites last checked more than 3 days ago — coverage that has quietly gone stale.
If there is genuinely nothing to report — no findings, no manual checks, no unscanned sites, no stale coverage — you get a short assurance email instead of a page of zeroes:
The most recent scans checked your 258 sites against published security advisories for WordPress core, plugins and themes. None of them has a known vulnerability at high severity or above.
Every digest closes with a link to the security tab on your dashboard, which is where the sites behind each count are actually named.
You will also get a matching in-app notification in the EasyEngine Dashboard notification tray, one per organization, linking to that organization’s Security tab.
The CSV attachment
When the digest has something to list, it arrives with a CSV spreadsheet attached — one row per site and advisory, ordered worst first, exactly as the Download button on the dashboard would give you.
Two things to know about the attachment:
- It contains the findings the email counts — the serious ones, plus every manual-check row. It is not a dump of every advisory ever matched; the dashboard is where you see the full picture including lower severities.
- Sites that were not scanned are not in the CSV. A site with no report has no rows. Those sites are named on the dashboard, which is why the email links there.
An all-clear digest carries no attachment — there would be nothing in it.
A second email: weekly updates
The Security Digest is not the only mail that can bring you to the Security tab. Separately from it, EasyEngine Dashboard sends a short “updates available” email every Monday morning when one of your sites is behind on WordPress, or is running a PHP version whose security support is running out.
It is deliberately brief — a couple of counted lines and one button:
2 of your sites are behind WordPress 7.2. 1 site is on PHP 8.2, which stops getting security fixes on 31 Dec 2026.
The button takes you to the Security tab with the Updates filter already applied, so you land on exactly the rows the email was about. If only one site is affected, it takes you straight to that site.
Three things worth knowing:
- It goes to the site’s owner, with organization admins copied in. That is a slightly different audience from the Security Digest.
- It counts the same rows the Security tab shows, so the email and the dashboard are always working from the same figures.
- It is a Version notification, not a Security one. If you want to turn it off, use the Version row in your Notification Preferences — not the Security row.
Because it is maintenance rather than a vulnerability report, it keeps arriving weekly until the sites are updated.
Managing digest notifications
Security notifications are controlled from your own profile, per channel.
To change them:
- Click your profile / user entry and open your user page.
- Scroll to Notification Preferences.
- Find the Security row — described as “Your scheduled digest of vulnerabilities found across your sites.”
- Use the two switches to turn Email and In-app on or off independently.
A few things worth knowing:
- Security email is on by default. Most categories default to in-app only; Security and Billing are the two that email you by default, because they are the ones you want to hear about without logging in.
- The two channels are independent. You can keep the in-app notice and switch the email off, or the other way round.
- Turning both off stops the digest for you personally. It does not affect anyone else, and it does not stop scanning — your dashboard keeps showing findings.
Fixing what you find
EasyEngine Dashboard reports; it does not update your site for you. Once you know what needs attention, the fix is almost always ordinary WordPress maintenance:
- Start with Critical, then High. The Version column tells you the latest version out there —
1.3.2 → 1.4.4means updating that plugin to 1.4.4 is a possibility which may clear the finding. - Take a backup first. Use the Backup & Restore tab on the site before a batch of updates.
- Update the plugin, theme or WordPress core from the site’s own WordPress admin, or through EasyEngine Dashboard’s bulk WordPress and PHP controls where available.
- If the row says “no update seen”, the site cannot see a newer version. For paid add-ons this nearly always means the licence key is missing or expired — renew or re-enter it, then update. If the add-on is abandoned, consider replacing or removing it.
- If the row is Informational, no update will ever clear it. Decide whether you still need that component.
- If the row says Needs review, someone has to look at it by hand — the version or the advisory could not be read automatically.
- Re-scan when you are done, and confirm the rows are gone.
A word on Updates rows: an out-of-date WordPress core or a PHP version nearing end of support is not a vulnerability today, but it is how sites end up vulnerable tomorrow. Keep them on your maintenance list.
Troubleshooting
The Security tab is missing
Work down this list:
- Is it a WordPress site? PHP and HTML sites have no Security tab. WP Cloud sites do not either.
- Is the feature on for your organization? Check Settings → Security. If the Settings page has no Security tab at all, EasyEngine hosting may not be enabled on your account.
- On a server page: the Security tab needs the server to be Healthy.
- On a site page: the tab appears for sites that are Live, Disabled or Disconnected. A site still being set up, or in a failed state, will not show it yet.
- Give the page a moment. The tab appears once EasyEngine Dashboard has confirmed the feature is available to you; on a slow connection that takes a second.
If you belong to more than one organization, the Security tab follows the organization you are currently switched into — not the one that owns the site you happen to be looking at. If the tab is not where you expect it, check which organization is selected.
A site was not scanned
Open Re-scan and read the plan table — it names the reason for every skipped site. See Reading the scan plan for what each reason means. The most common ones are:
- The site is not Live, is disconnected, or is locked.
- Security Advisories is off for its organization.
- It is not a WordPress site.
If the site is fine but has still never been scanned, run a Full scan on it directly from its own Security tab.
The results look out of date
- Hover the Timer icon above the table for Last scan and Next scheduled scan.
- Next scheduled scan is when the nightly sweep starts, not a promise about when this particular site finishes. If it says nothing at all, these sites are not currently on the schedule — usually because the feature is off, or because none of them is currently eligible for a scan.
- To get a fresh answer now, click Re-scan. Pick Full scan if the site has changed; Re-match stored inventory is enough if you only want to check against newer advisories.
- If the table says Reports Need a Fresh Scan, the saved results are in an older format. Run a scan and they will be rebuilt.
- If the digest mentions sites “last checked more than 3 days ago”, those sites’ data has gone stale — usually because the nightly refresh has not been able to reach them. Check the site’s connection status.
I did not receive a digest
- Check your notification preferences. Profile → Notification Preferences → Security → the Email switch.
- Check whether you are a recipient. You need to own a site, or be the owner, an admin or a manager of an organization that has sites. A plain organization member does not receive the digest.
- Nothing may have changed. An unchanged digest is only re-sent once a week — that is by design, not a fault.
- Everything may be below the threshold. By default the digest talks about High and Critical. Lower-severity findings show on the dashboard without triggering an email. Your EasyEngine Dashboard administrator can change the threshold.
- Check your spam folder, and that Security Advisories is enabled for your organization.
The report says a site is clean, but I know it has a problem
The report only knows about published advisories for the versions it has on record. Three things it cannot tell you:
- A vulnerability nobody has published an advisory for yet.
- A problem in custom code written specially for your site.
- Anything about a site it has not scanned — which is exactly why skipped sites are always listed rather than quietly dropped.
Treat Security Advisories as a strong safety net, not a certificate of health.