Visibility Without Logging Into the Server
Real-time logs, version stats, and insights — all from your dashboard.
Key Highlights
Live Logs Per Site
NGINX, PHP, WordPress logs in real time.
System & Usage Insights
Track WordPress/PHP versions, server, site counts and more.
New Relic Integration
Deep observability with time-series metrics and performance breakdowns.
How it works
1
View Site/Server Panel
Logs are available directly inside the site/server tab.
2
Connect New Relic (Optional)
Paste your New Relic key for detailed breakdowns.
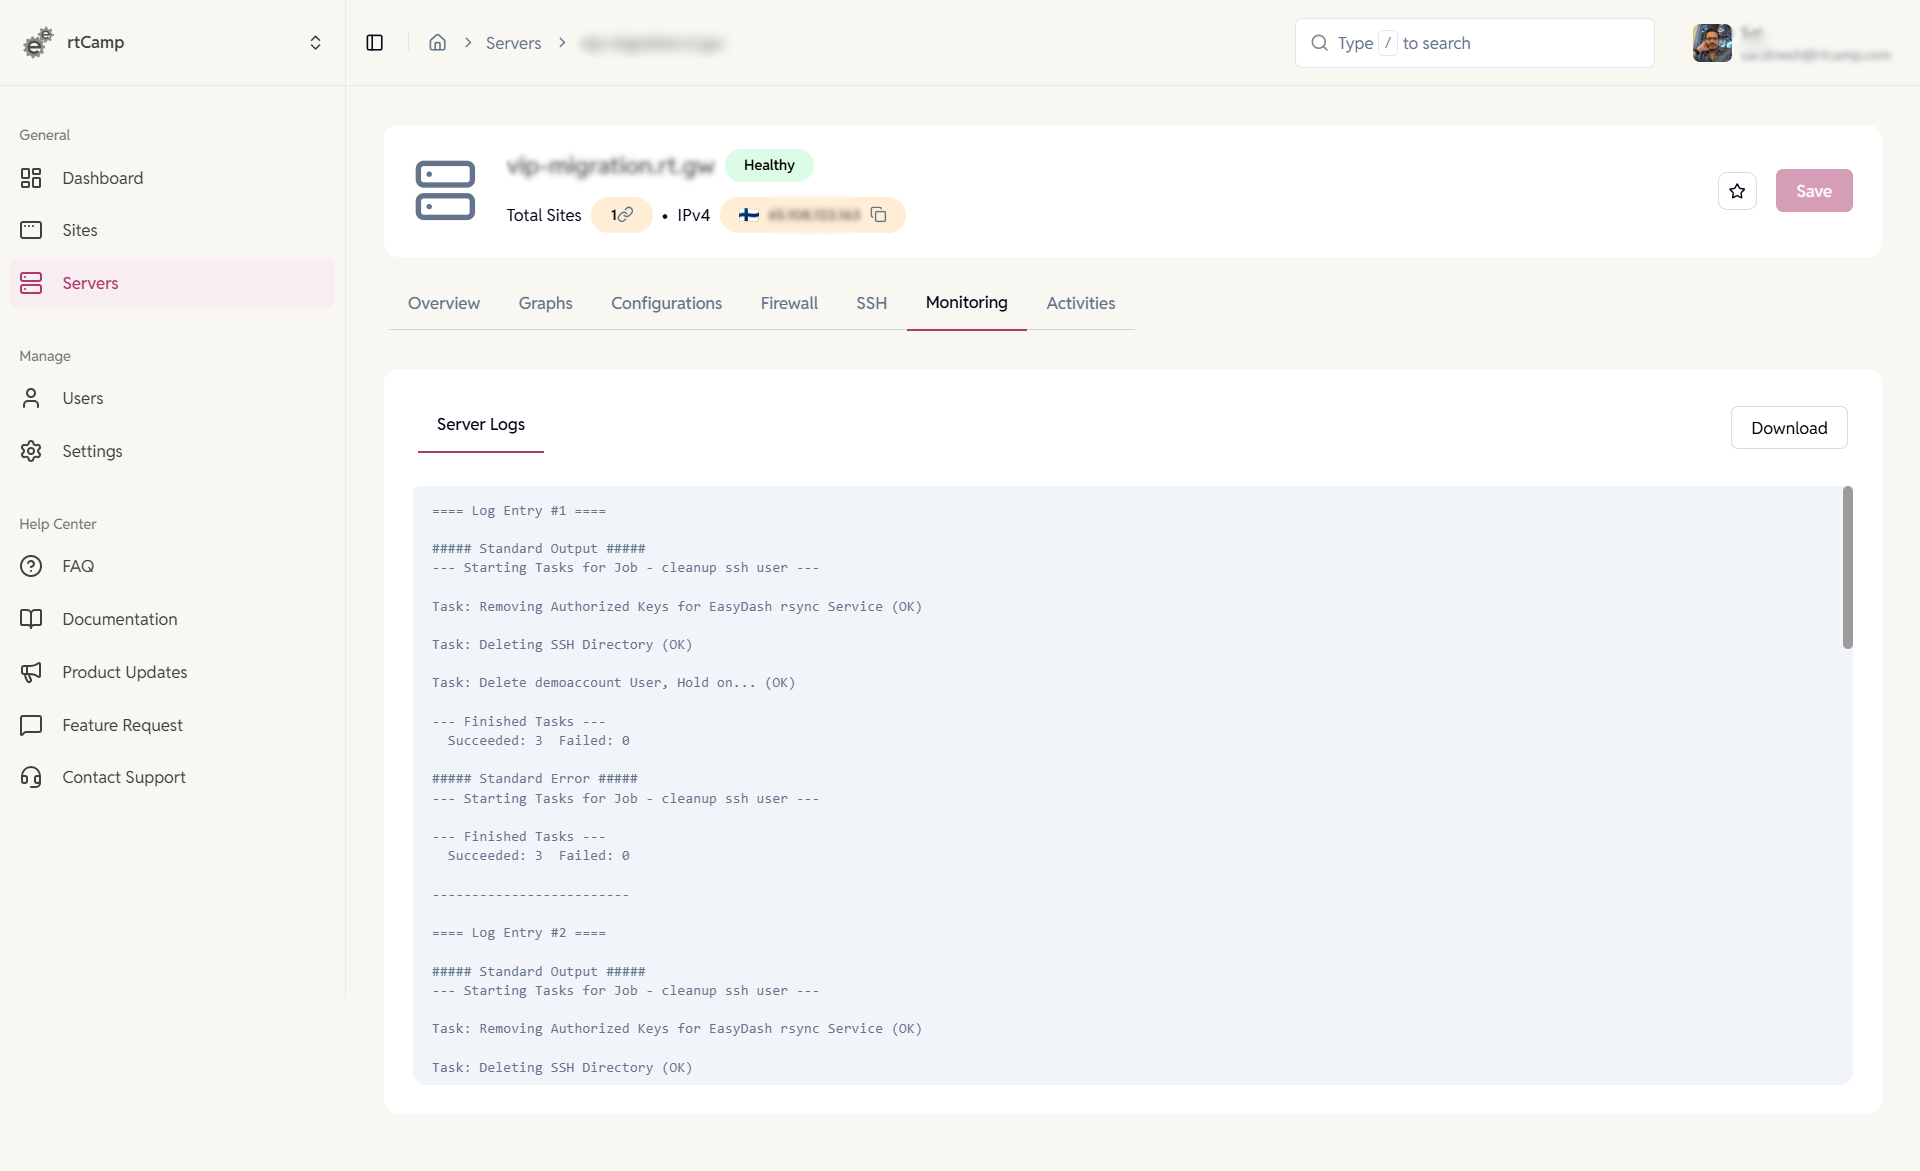
Server Logs
Maintain visibility at the infrastructure level.
- View server and SSH activity logs.
- Track automation and maintenance tasks.
- Download logs for audits and diagnostics.
- Identify errors and failures quickly.
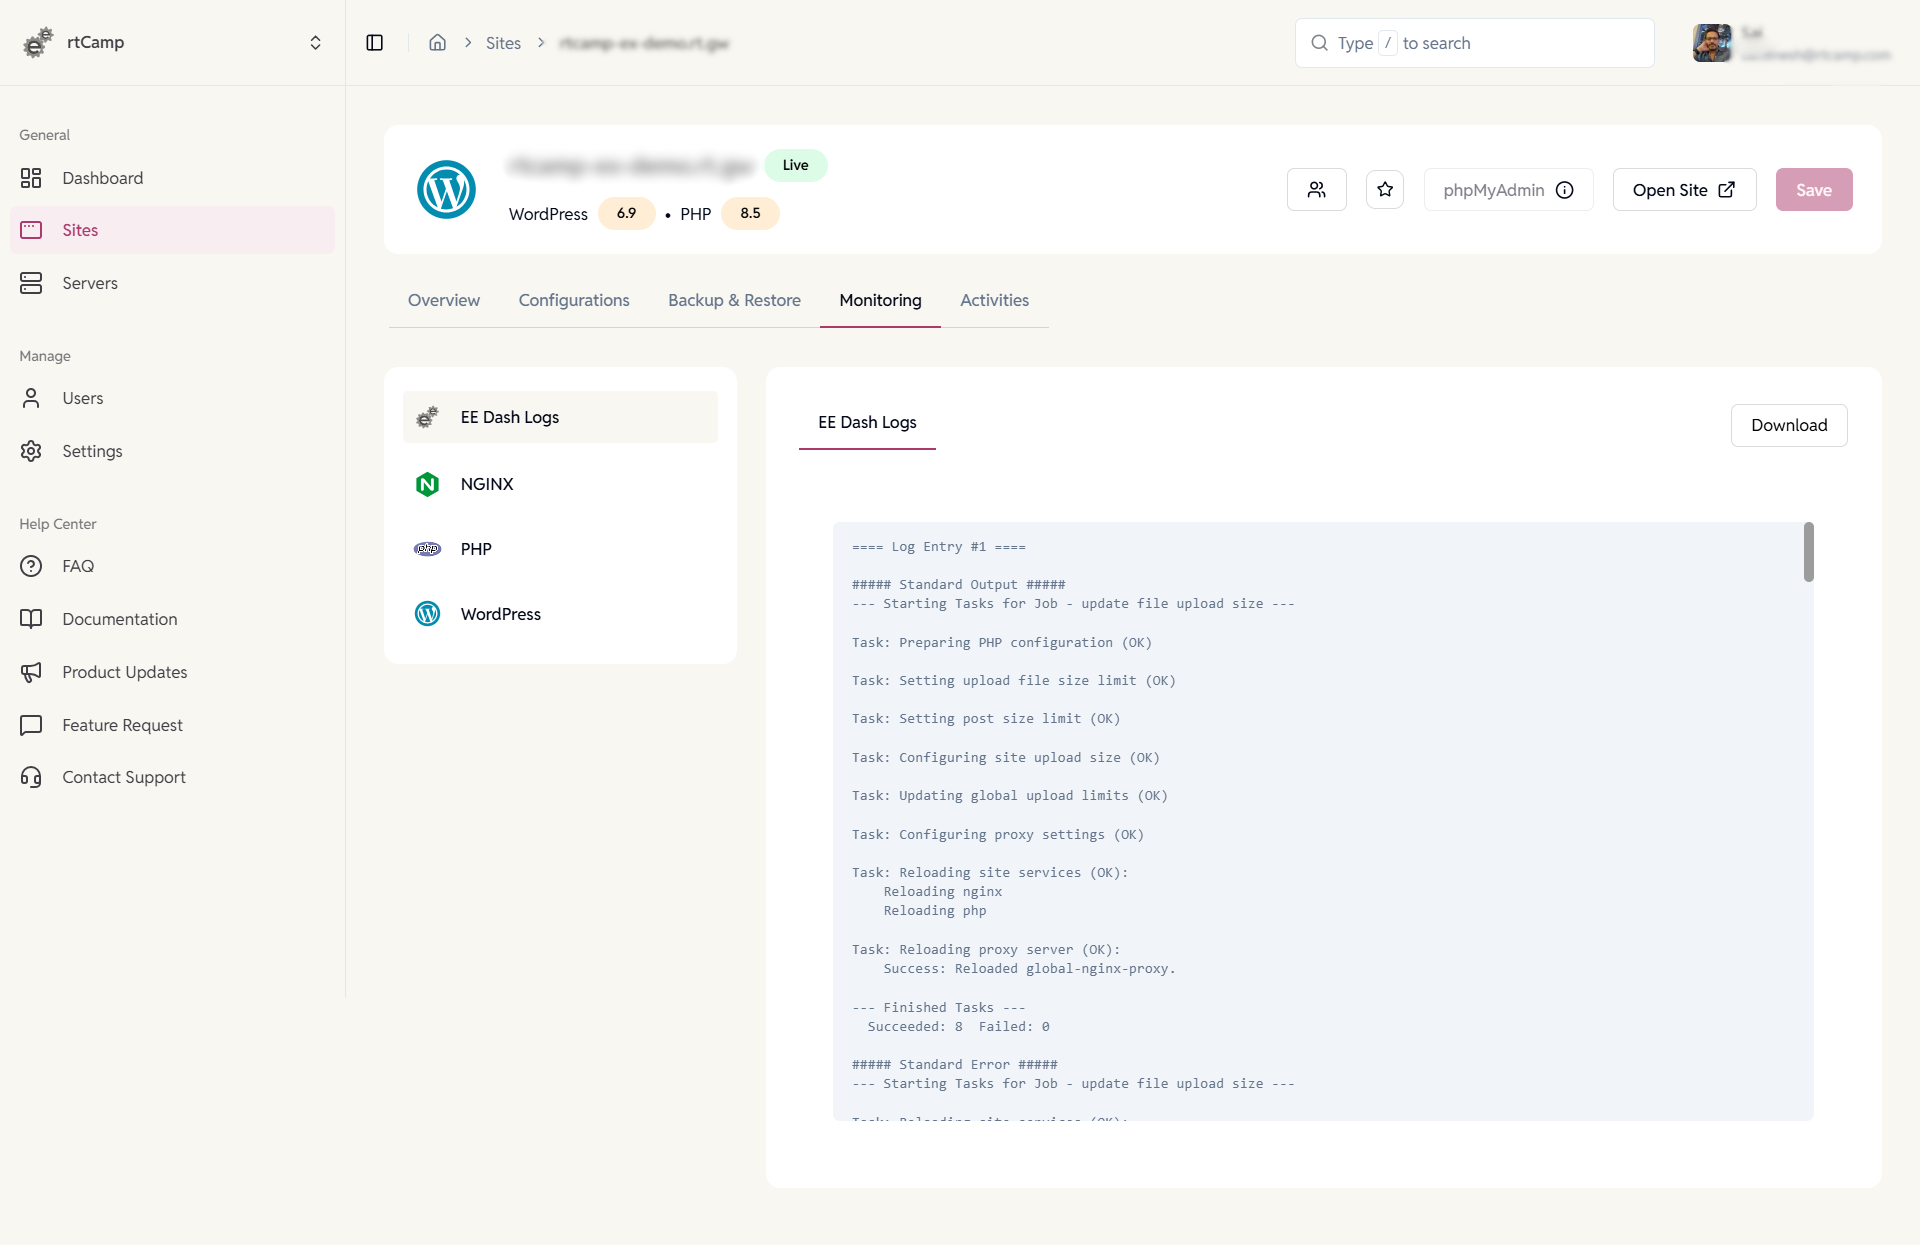
EE WordPress Site Logs
Monitor site and platform activity in one place.
- View EasyEngine logs for site actions and system jobs
- Inspect NGINX, PHP, and WordPress logs
- Download logs for review or sharing
- Track task execution and status updates
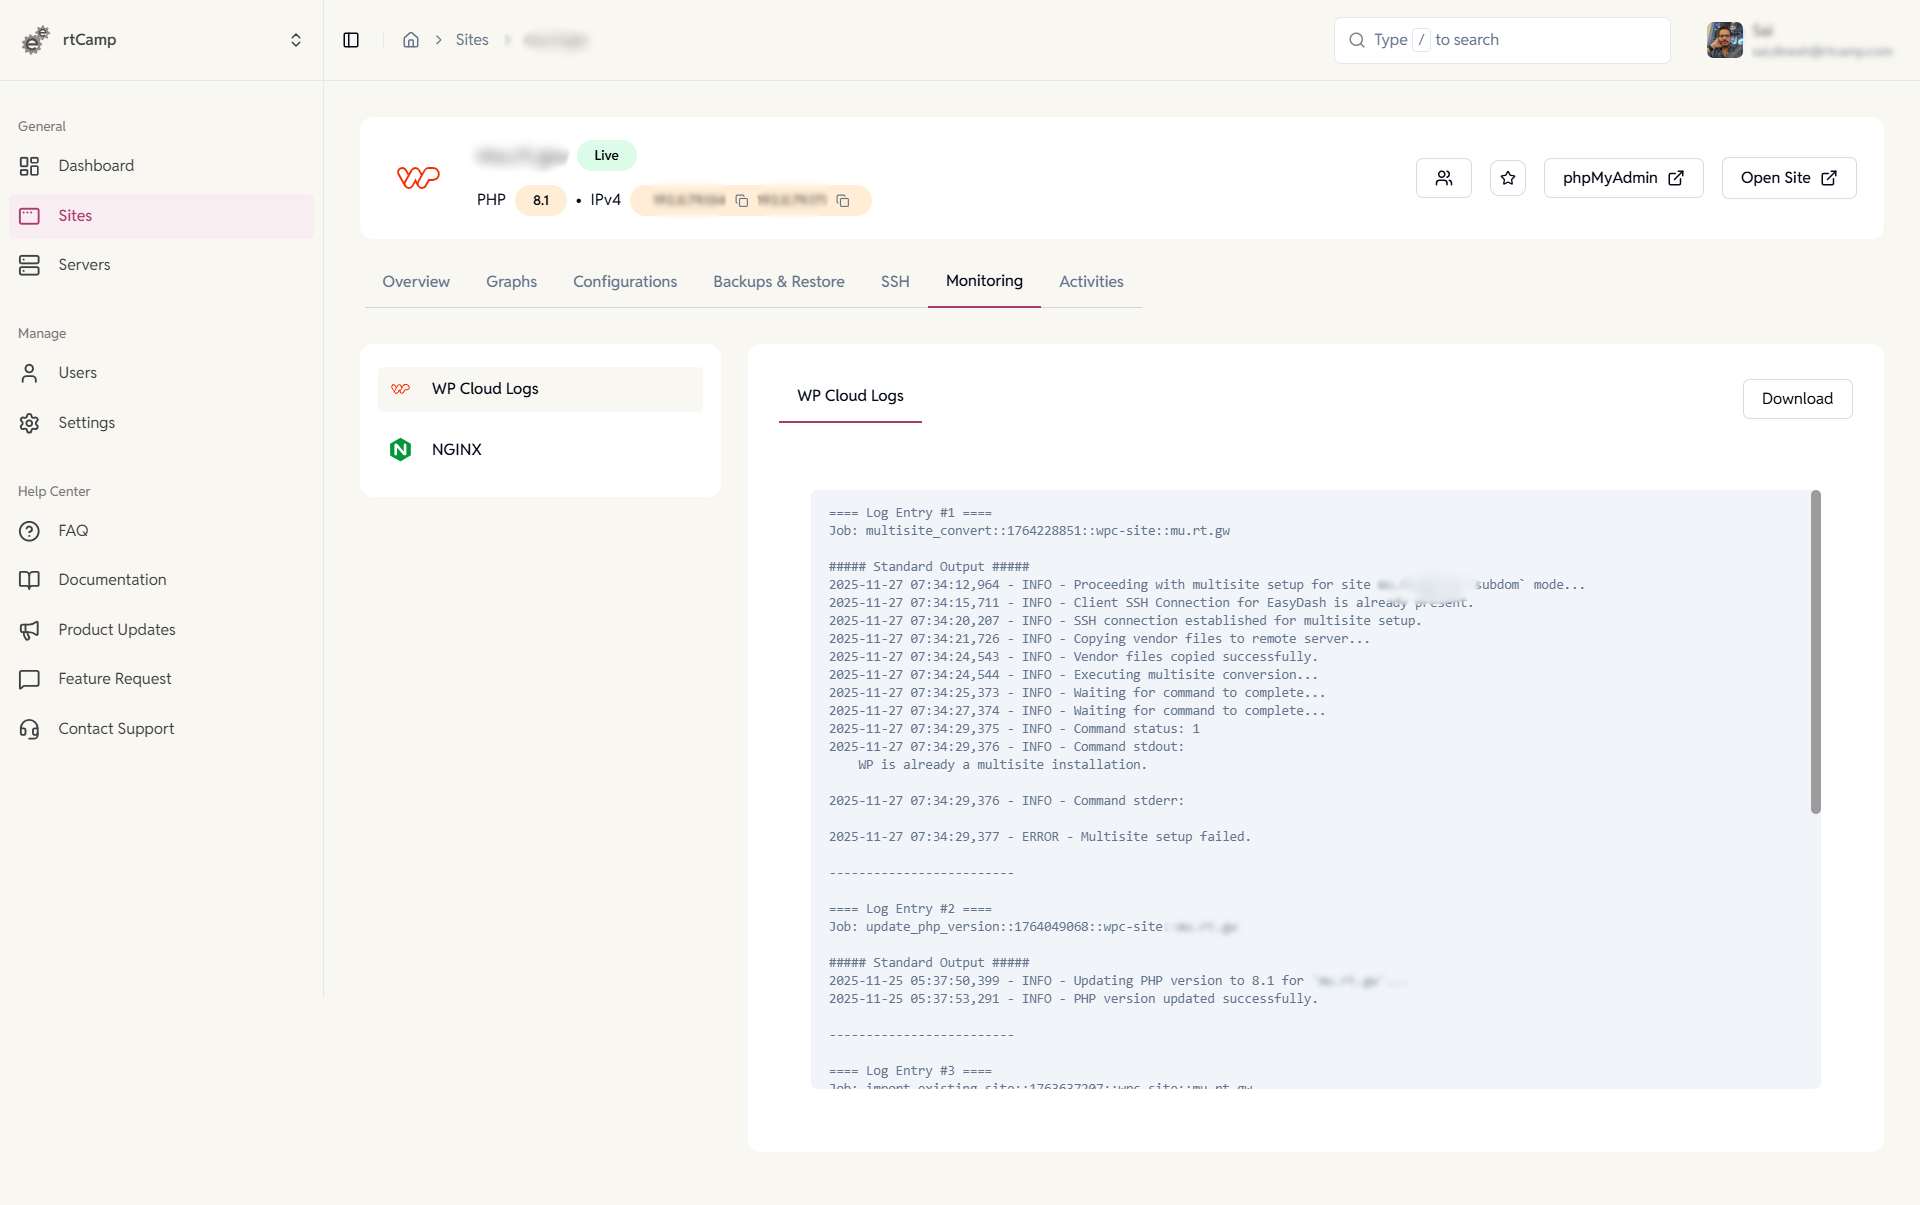
WP Cloud WordPress Site Logs
Stay on top of site operations and changes.
- Access WP Cloud and NGINX logs.
- Monitor site setup and configuration updates.
- Track multisite and PHP changes.
- Download logs for troubleshooting.
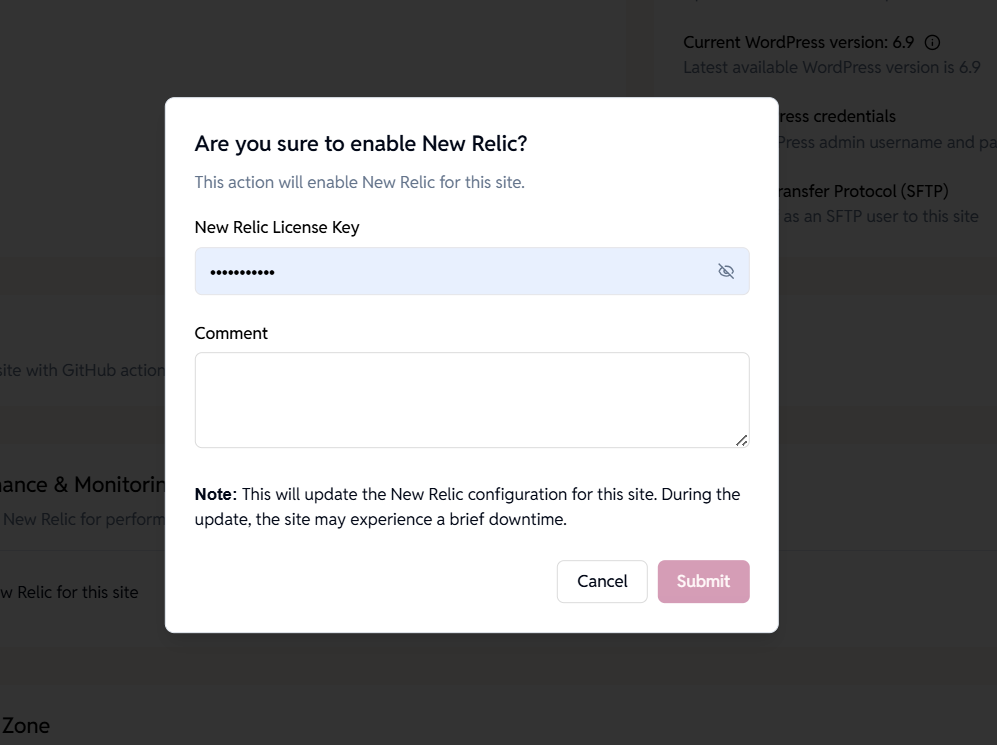
Enable New Relic Monitoring
Activate performance insights for your EE WordPress site.
- Add your New Relic license key.
- Enable monitoring from the dashboard.
- Track response times and slow requests.
FAQ
Have more questions?
Do I get live logs for each site?
Yes, the top 50-100 lines are viewable from the dashboard. SSH into the site/server for more.
Can I integrate my New Relic?
Yes, add your license key per site, and the configuration is updated.